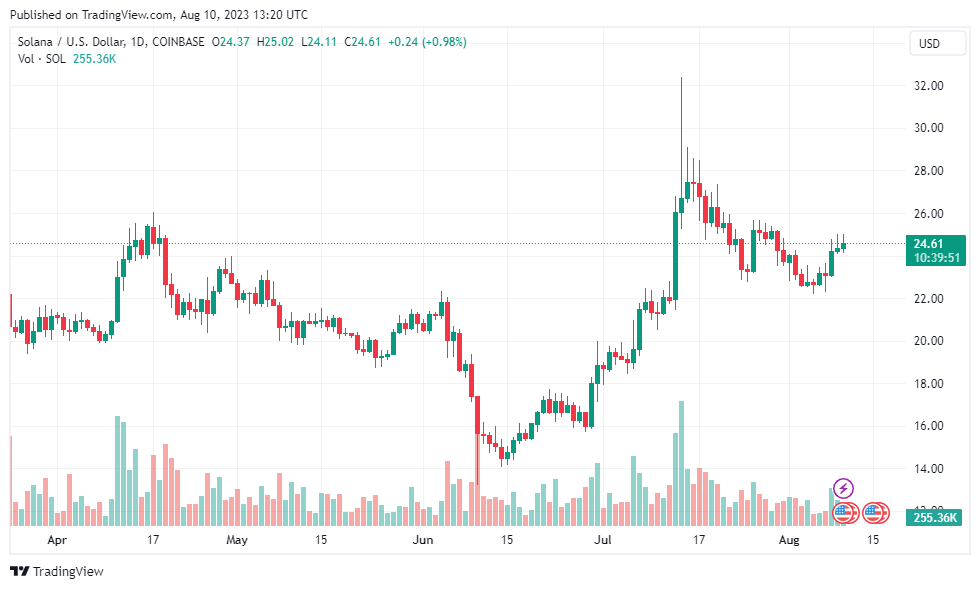
Solana (SOL) has witnessed intense price swings lately, echoing the broader crypto market. At present, SOL stands above $24, boasting an impressive 8.01% surge in just seven days, with a trading volume exceeding $376 million over the preceding 24-hour span.
Aiming for $30: Fanning Investor Speculation
Among crypto enthusiasts and investors, SOL’s ongoing movement has sparked speculation about breaching the notable $30 resistance threshold. As SOL’s ascent persists, market participants’ anticipation intensifies, creating an environment ripe with intrigue and potential market shifts.
Crucial Factors Shaping SOL’s Price Movement
Solana’s journey upward has been punctuated by a significant rise in its Total Value Locked (TVL), highlighting the platform’s robust presence in the digital realm. Careful analysis, courtesy of Messari’s data, reveals that Solana has outperformed its blockchain counterparts, registering a remarkable 14% surge in immobilized funds over the past month.
Further insights from DeFi Llama underscore SOL’s climb to become the 9th largest blockchain network in terms of locked assets. This ascension is underlined by a staggering figure of approximately $320.07 million in locked assets, a significant leap from the initial $205.11 million valuation at the start of the year.
Elevated Total Value Locked (TVL) acts as a magnet, attracting individuals keen on acquiring SOL tokens. This heightened interest potentially spurs demand for Solana’s tokens, exerting upward pressure on their valuation.
Balancing Act: Navigating Upsides and Risks
Nevertheless, the landscape maintains a delicate balance where optimism meets potential challenges. Despite growing TVL, unforeseen negative developments in security or performance might prompt investors to sell SOL holdings, causing an influx of supply and a subsequent price drop.
SOL’s Current Valuation and Price Trends
Based on data from the SOLUSD price chart on TradingView.com, SOL’s current valuation hovers around $24.61, evident in the daily chart. This valuation provides a foundation for subsequent analyses.
Analyzing SOL’s Journey Toward $30
Delving into SOL’s price trajectory, its performance within the last 24-hour market cycle stands predominantly favorable. The daily chart reveals SOL trading above the Simple Moving Average (SMA) indicator, emblematic of bullish momentum. This trajectory indicates a promising uptrend and underscores the asset’s capacity to sustain upward momentum.
An essential aspect of SOL’s trajectory is consistent buyer engagement, propelling valuation upwards and implying sustained demand that fosters potential price appreciation. Additionally, the SMA serves as support during price dips and can transform into a resistance level if the price surpasses significantly.

Balance and Momentum: Deciphering Strength
Considering the broader context, the Relative Strength Index (RSI) at 55 suggests equilibrium, signaling a balance between overbought and oversold conditions. This equilibrium offers insight into SOL’s position within the broader landscape.
Shifting focus to the Moving Average Convergence Divergence (MACD), a potential momentum shift emerges. The fading red histogram bar hints at an attempt to cross over the signal line, suggesting the possibility of a strengthening upward trajectory.
If you want to receive early daily news highlights, profitable trading signals and reports with cryptos with high earning potentials, sign up for CryptoChannel!

